
Enhancing Profitability Through Value Stream Mapping
In today’s competitive industrial landscape, companies are under constant pressure to maximize efficiency, minimize waste, and continuously improve their processes in order to drive profitability. To meet these challenges head-on, many organisations are turning to Value Stream Mapping (VSM) as a fundamental tool in their continuous improvement arsenal.
In this article, I will discuss the practical application of VSM in driving continuous improvement
thinking and profitability and demonstrate the value of VSM from examples particularly but not exclusively in manufacturing that have reduced waste and thereby improved profitability.
VSM identifies and eliminates the 8 wastes within any process: waiting time, over production, rework, excess movement, excess processing, wasting people’s skills and intellect, too much inventory, and inefficient transportation.

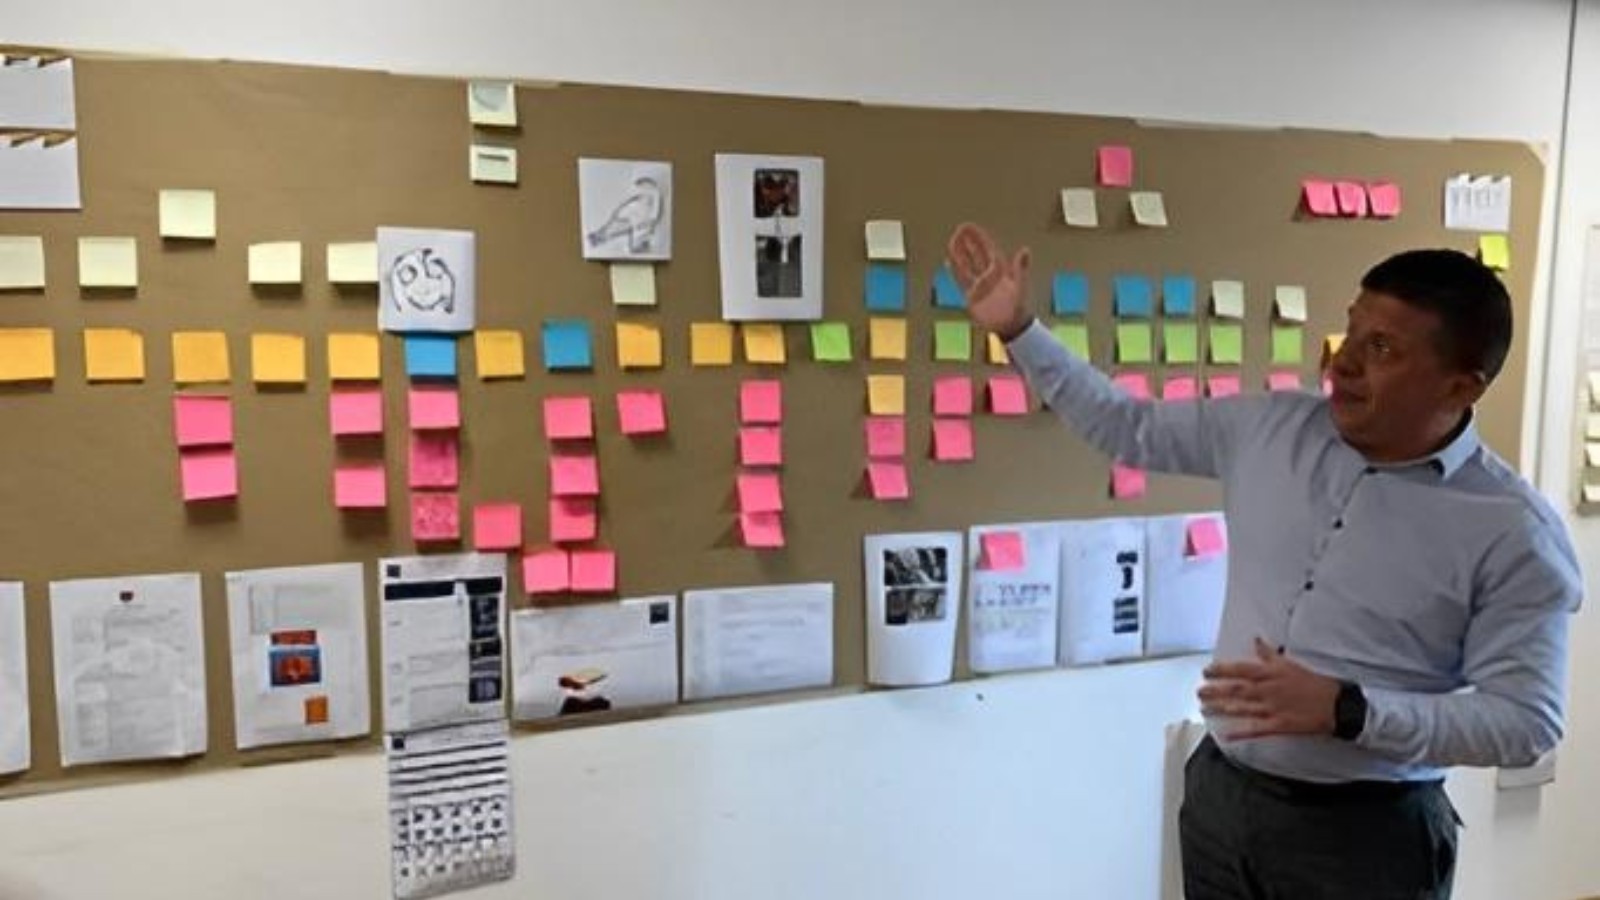
Figure 1. VSM completed by trainees on the Project7 Manufacturing Excellence Programme.
Understanding Value Stream Analysis
Though originally developed for Lean manufacturing in the automotive industry, I want to make the
point that VSM is not just a tool for the manufacturing industry. Though I have primarily used the
tool to improve processes in manufacturing, I have also used VSM and seen it used very successfully
to reduce machine down times, reduce truck loading times from 2.5 hours to 40 minutes, reducing
the time in a finance department for end of month closing from 11 days to 4 days, reducing the process time for insurance claims, and even increasing the throughput of patients to better utilise
operating teams and operating theatre utilization in hospitals.
VSM provides a clear visualization as in Figure 1, of a process journey from inputs (e.g. raw materials,
patients, loading order received) to outputs (e.g. car off the production line, patient delivered to the
recovery suite, truck leaves the loading dock). VSM highlights all non-value-added steps and
bottlenecks that hinder efficiency and enables teams to remove these wastes, thus increasing
productivity and profitability.
The Team
If you want to get the very best solution out of a VSM exercise, you must have the right people on
the VSM team. This team needs to be those who carry out the process under change and who will
have to own the future state. These are the people who understand, map, problem solve, and
provide the sustainable solution. This is not an exercise for department heads locked away in a
conference room.
The Methodology
Firstly, if you are just starting out with VSM, don’t over complicate this process. I tell my clients and
course delegates (Figure 1.) that it is better to achieve an 80% solution when getting started than to
get bogged down in process and never complete. VSM has its purists and I salute them; however,
you do not need to be an expert to begin VSM; there is enough in this article to get you started and
to achieve results. If you are nervous about running your first VSM exercise, ask if there is already
someone in your organisation that can coach you until you feel confident to go solo. If you do not
have such a resource, you can call in a specialist. That said, you will learn a lot by just following the
simple process below with your VSM team:
1. Define the Scope.
Probably one of the most important pieces of advice that I can give is to take the time to clearly
define the boundaries of the value stream you want to map. So much time can be wasted looking at
external inputs and processes; being specific will increase your likelihood of success. Determining
exactly what you want to improve will save you time and frustration. For example, if you want to
improve the machining of a car part, don’t look at forging or distribution. Likewise too is you want to
improve the throughput of patients through an operating theatre, don’t spend time looking at the
maintenance of the anaesthetic equipment.
2. Identify the Current State.
Using the people who own and work with the current process, physically walk the process
observing and documenting every step involved. Gather data on cycle times, Work In Progress (WIP),
and other relevant metrics, having accurate data will save you time later. Lastly, identify all the
processes, activities, and people that are elements in the value stream.
3. Create a Current State Map.
Map a visual representation of the current state, including all the steps, processes, and information
flows. As in Figure 1., I recommend using simple Post-it notes on a sheet of brown paper to record
the process. Mapping onto a brown paper sheet is useful as the work can be rolled up if a room
needs to be cleared. The current state is mapped exactly as it is observed, with a single colour Post-It
note horizontally across the map, or different colours to represent actions by a single department.
Decide on a process that works for you and stick with it. Avoid every temptation at this stage to
reengineer the process or discuss reengineering; yes, you can collect ideas and place them under the
step in a different colour to refer to later, but at this stage just record what you see. Keep it simple.
Use standardized symbols and labels to represent different elements of the process such as a hard
copy work instruction, a computer process, transportation, or a face-to-face conversation or a phone
call. These symbols may already be in use in your organisation but if they are not, you will find
options as a result of an internet search. Write these symbols on the bottom right of each Post-it
note. Write the actual time it takes to complete an action onto the Post-It note. The sum of these
times is the first best estimate of how long a task should take without waiting time, etc.
Once the current state map is complete, make sure the team is in complete agreement
before moving on. It is always interesting to listen to the conversations at this point as
‘lightbulb’ moments occur such as “I never knew you did that,” or “I do that exact same
thing at the end of the process,” or a manager saying, “I have run this line for 5 years and
never understood how we got from step 5 to step 6.” You may also find that essential steps
are carried out successfully by experienced individuals without any written process or
instructions. Capturing these will help you provide for business continuity when the person
is on holiday, is promoted or retires. Again this is critical to efficiency and profitability.
4. Calculate Key Metrics.
Calculate relevant current state performance metrics such as cycle time, lead time, or completed
actions per hour. Make these as accurate as possible, ideally from direct observation. These will
help you measure savings when you have the future state metrics sustained as a result of the VSM
process. It is important to plan to measure the change as carrying out a VSM, pulling people away
from work for 1, 2, or 3 days costs money and time, and VSM is designed to reduce and not add to
your costs.
5. Identify Waste.
Analyse the current state map with the entire team to identify and categorize the 8 wastes. By
looking specifically for the 8, you will have a far better chance of driving them out as opposed to
some other less structured approach. For example, when running the finance department VSM we
found that not only was the same data being collected by two different departments, but also data
was being collected that had become redundant several months earlier. Specificity will bring
accuracy.
6. Develop the Future State.
Leave the current state map as it is and now duplicate the process steps using clean Post-It notes,
adding new steps, removing waste, redundancy, and parallel paths, etc., as you design future state
for the value stream. Keeping the old map will give you a constant reference to which to return for
reference. Your team once faced with how the current state works (or does not work), will very
quickly see how and where to make the necessary improvements. Using the Post-It notes now
allows you to move them around, add new ones, or subsume several steps at different locations into
one value added step. Go back to your scope definition and resist the temptation for ‘mission
creep’ i.e., stick to the defined scope. If you need to better understand the inputs and outputs of
your process, you could carry out a simple SIPOC exercise which I will not explain here but you can
find how to action a SIPOC from an internet search. Likewise, if you need to establish who is
responsible or just needs to be informed about a specific action, carry out a RACI exercise. Again,
you will find out how to do this from an internet search. Finally, remove or reduce identified wastes
and improve process flow and then set specific goals and objectives for the future state. This is your
VSM solution, agreed upon by the whole team, that drives out waste and improves profitability.
7. Develop an Action Plan.
Create a detailed plan for implementing the changes required to move from the current state
to the future state. Do this by defining each action with its agreed priorities for the improvement
opportunities. Importantly, state who is responsible for each action and agree on completion times.
8. Implement Improvements.
Execute the action plan making the necessary changes to the future state value stream. Then
monitor progress and continue to make adjustments particularly as new ideas for savings come to
light. Remember this is a continuous improvement exercise so do not become protective or
intractable over your first solution.
9. Re-calculate Key Metrics.
Once the process has had time to bed-in, observe, measure and re-calculate the current
state performance metrics to demonstrate the change and record the value of the mapping exercise.
These metrics are now the new daily targets.
10. Monitor and Sustain.
Continuously monitor the performance of the value stream against the new metrics. It is
important to ensure that improvements are sustained with Leaders Standard Work, Short Interval
Control, Process Confirmation, etc., and make further adjustments as required. VSM is costly in
terms of the team’s time, so respect that time by instituting robust sustaining tools and processes.
11. Share and Communicate.
Share the value stream map and improvement progress with all relevant stakeholders and
any similar operations in your business. In Lean, this is called Yokoten, the sharing of best practice.
Maximise the benefit of your VSM so all areas of your business can share what you have learned
about how to increase profitability by driving out waste.
Use the VSM to start a conversation and foster a culture of continuous improvement and learning. It
is also important to remember that particularly when starting out that VSM is a dynamic process,
and it may require multiple iterations to achieve the desired level of optimization and efficiency.
That is ok, it’s important for the team to learn and grow together to build both competence and
consistency.
Impact on Profitability
The impact of Value Stream Mapping on profitability cannot be overstated. By consistently and
rigorously applying VSM principles, organisations can experience several tangible benefits including:
- Cost Reduction: VSM identifies opportunities to eliminate waste, optimize resource
utilization, and reduce operational costs, leading to improved profit margins.
- Increased Productivity: Improved efficiency, reduced lead times, and a streamlined
production process can boost productivity, allowing companies to produce more with the
same resources. - Enhanced Quality: Identifying and addressing defects and process inefficiencies leads to
consistently better product quality and fewer costly rework or warranty claims. - Competitive Advantage: Continuously improving the value stream allows organisations to
adapt to changing market conditions more quickly, giving them a competitive edge in the
marketplace. - Customer Loyalty: Meeting and exceeding customer expectations through value stream
improvements can lead to higher customer retention and loyalty. I have even brought the
customer into this process to build relationships and demonstrate the importance of getting
‘it’ right for the customer.
Conclusion
Value Stream Analysis is a powerful tool for organisations looking to achieve continuous
improvement and increased profitability. By identifying and eliminating waste, enhancing efficiency,
and fostering a customer-centric culture, businesses can drive innovation and maintain a competitive
edge in today’s rapidly evolving industrial landscape. Embracing VSM as a cornerstone of continuous
improvement thinking can lead to long-term success and sustainable growth, making it an invaluable
asset for any industrial operation.
Importantly, you do not need to be an expert to use VSM or any of the tools of Lean to drive out
waste and increase profitability. You just need a group of people who want to improve business and
are willing to learn and have a go. Good luck.

Failed Business Metrics
Introduction – Failed Business Metrics
If the business metrics that you are putting your focus, time, and energy into are not driving your business then you must ask if those metrics are failing your business. A successful metric should be growing your business; that means improving your equipment reliability, increasing your customer base and improving customer experience, maximizing your output margin and profitability, and optimizing your workforce.
Metrics
Let me first define leading and lagging metrics:
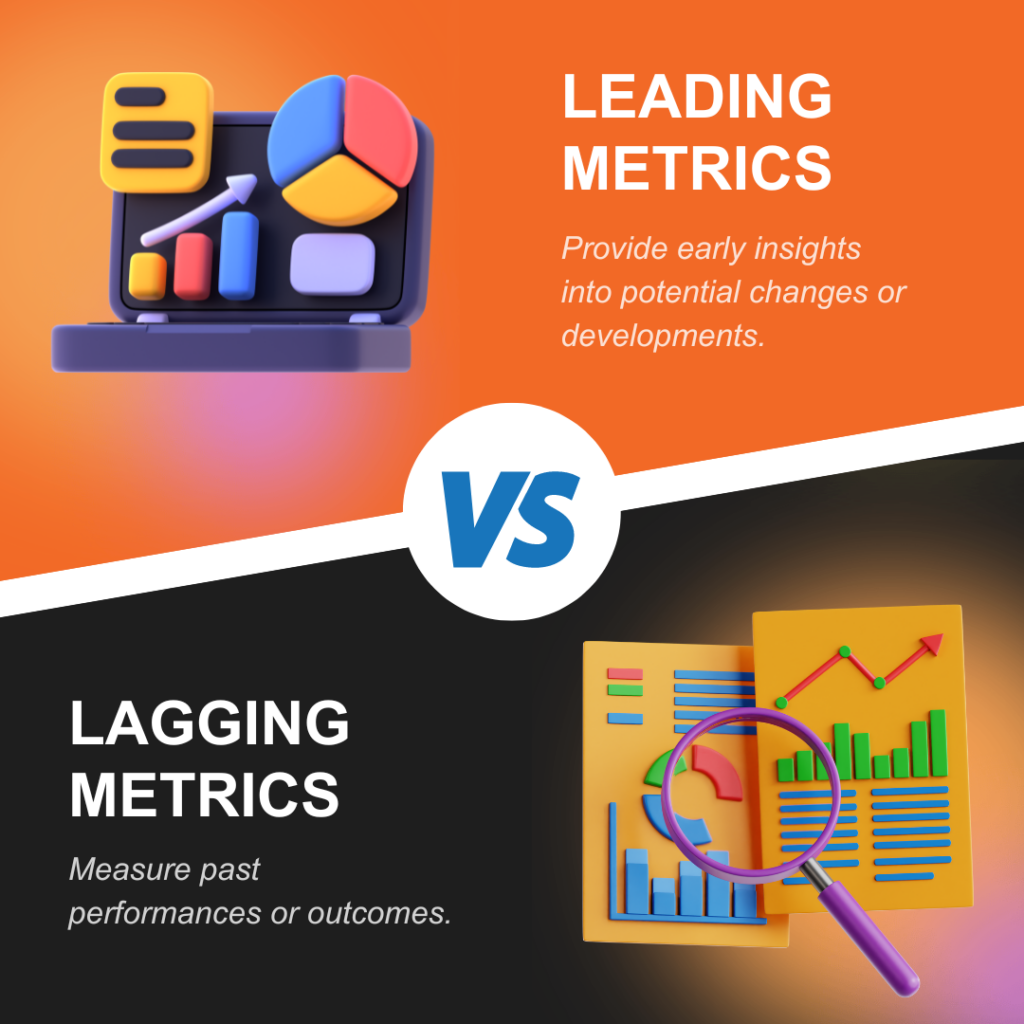
Leading metrics are valuable because they can serve as early warning signs or predictive tools, helping organizations and individuals make informed decisions and take proactive actions to achieve desired outcomes or avoid undesirable ones. Lagging metrics are little more than ‘dead’ data.
Reality
The reality of what I see too often is that business focuses on the output or lagging metric, and when the metric falls short of goal, managers react with a raft of activity to try and ‘plug the leak’ without truly addressing the real issues. This can be everything from a root cause investigation to a reorganization, to focus groups, to the easiest option of firing a few people. But what has changed down the line if these actions were not focused on a leading metric? You are right, very little to nothing at all.
Don’t get me wrong, as a Lean OpEx consultant I have a passion for data and metrics, but they must be the right metrics; they must be leading metrics that drive and sustain business change.
Here are a few examples of how to turn the wrong metrics into the right metrics:
I worked with a company that were very proud that they were now accurately capturing ‘all their safety metrics’ and as a result were able to investigate ‘every’ safety incident and put into place mitigation to avoid ‘every’ accident. However, they were not capturing the near misses that research shows are the indicators of future accidents.
Another company was very happy that they had a proactive campaign that meant every employee has to capture 1 near miss per week (spot the problem with this one?) However, when I asked the store’s supervisor how many Band-aids were used in one year the answer across what was a very large production facility was around 2000. When I looked in the first aid log, I could only find 12 incidents that has needed a Band-aid. So which was true? The metric that gave the best picture was the storeroom Band-aid consumption rate; that was the true indicator of incidents, not the first aid log.


Reliability
The same story should be seen in reliability. What steps are being taken on input ‘leading’ business metrics rather than just publishing the output metric? Take Mean Time Between Failures (MTBF), there is little point publishing graphs of MTBF as a lagging metric if they are not driving change in input leading metrics to improve MTBF. If MTBF is poor, we have to look at training, quality of the equipment, servicing frequency, tool serviceability, test equipment calibration, personnel training and importantly the quality of SOPs and especially PMs and PdMs, etc. Focusing on the leading metric will directly impact the lagging metric.
Failed Business Metrics – Conclusion
If your metrics are little more than wallpaper, ask yourself if you are focusing on lagging rather than leading metrics. If your metrics are not driving your business, you are almost certainly not focusing on the right metrics to effect change.

The CMMS: Where Data Goes to Die – Unleashing the Potential of Your Maintenance Digital Backbone
In the bustling realm of modern manufacturing, where precision and efficiency reign supreme, the digital technology of Industry 4.0 plays a pivotal role. Among the myriad of tools and systems at a maintenance managers disposal is the Computerized Maintenance Management System (CMMS). The CMMS can be the digital backbone for maintenance, providing streamlined planning and execution, parts management, and data-driven decisions that importantly drive reduced downtime. Yet, for many manufacturing enterprises, the CMMS has earned a dubious reputation – as the place where data goes to die.

The Power of Data
We have learnt the lesson that as engineering and maintenance managers we need data. We have spent thousands of Dollars/Euros/Pounds implementing great data gathering Computerized Maintenance Management System. We have upgraded, added functionality, attached BOMs and listened to the evangelists for critical asset care, management of storeroom parts and data driven iterative maintenance management.
However, maintenance defects can still account for more than 30% of all machine lost time, and machine availability in the OEE equation can frequently be less than 60%. Maintenance departments are still too busy to fix a problem correctly the first time but invariably find time to shut down a machine for a second or third time until they eventually ‘find’ the fix. Lastly reacting to breakdowns in some businesses can expend more than 40% of maintenance person hours and cost the maintenance budget 4 to 15 times more than if data driven PMs or fault finding were used in the first place.
So what is going wrong? What I often see is that data is put into the CMMS almost as a comfortable place to rest and ‘die’, and all too often this data which is costly to collect has little or no effect on building reliability, driving OEE or building business profitability. The purpose of a CMMS is not as a repository but as a fuel tank to drive the engine of reliability.
Intelligent use of CMMS data is key to:
- PM design and ongoing optimization.
- Intelligent FRACAS.
- Business altering FME(C)A.
- Problem solving that is done once and once only.
- Building a data set as evidence for a business case for adding people or skills to the maintenance team.
- Driving machine availability e.g through Autonomous Maintenance.
- Improving business impacting OEE.
- Saving time across all the 8 wastes.
- Intelligent structuring of the maintenance team.
- Location of the Maintenance team and tool kits be that central and satellite locations and impact on MTTR.
- Future layout changes to optimise flow.
- Future equipment design.
- Purchase of additional maintenance equipment to reduce MTTR.
- Further technician training to reduce MTBF
- Optimisation of assets in the storeroom min/max levels, inventory value etc.
CMMS software is designed to capture and manage data to drive equipment reliability and impact business. If your CMMS is not being used to drive the list above you are not maximising the CMMS potential of exploiting its value to you as the Maintenance or Engineering Manager. When I take a look at how CMMS data is used by my clients that I see far too often that data underutilization is rife, and that data is metaphorically buried never to be seen again. So the simple message to my fellow maintenance professionals is that when it comes to the CMMS don’t bury data, be a data miner!
Reviving Computerized Maintenance Management System Best Practices
It’s time for maintainers to rethink their CMMS strategy and unlock its full potential. Here are three best practices to ensure that your CMMS becomes a data mine, rather than a data graveyard:

Budget and Time
A major change that is needed in implementing CMMS optimisation is provision of an ongoing budget to manage and train our people to interrogate and manipulate CMMS data. If our employees do not know how to add intelligence to the data to solve problems, then we can’t expect them to use that data to improve machine reliability. Plan time into the budget to train staff on FRACAS, 6 Sigma DMAIC, trend analysis, FMECA, and other established statistical and Lean tools that will exploit your collected data. A well-informed team is more likely to use the system effectively and consistently.
Set Clear Expectations
There should be a business expectation that data is a source to drive business. When leaders set the expectation, lead by example, and remove the barriers, then data driven business becomes a source for driving revenue and increasing margin.
Regularly Review and Refine Computerized Maintenance Management System Processes
Continuously evaluate your CMMS data interrogation and mining processes and adapt them as needed, such as to drive ongoing PM Optimisation. Solicit feedback from your team as to which area or equipment data should be analysed to identify areas for improvement. Use data to find and improve your top 10 unreliable pieces of equipment. CMMS data interrogation should be your first point of contact for improving machine reliability and continuous improvement.
Conclusion – Computerized Maintenance Management System Potential
The CMMS, once relegated to the shadows as the place where data goes to die, can become a beacon of efficiency and intelligence in building your machine reliability. To achieve this transformation, we as maintenance professionals must recognize that the CMMS is not just a data repository but a powerful tool for optimizing machine reliability.
By investing in training, integrating with cutting-edge tools and technologies, setting data entry standards, prioritizing data use and fostering a culture of data interrogation and continuous improvement, maintenance leadership can breathe life into their CMMS.
Only with use will your Computerized Maintenance Management System evolve from a stagnant data graveyard to a fuel tank to drive machine availability and operational excellence in the Industry 4.0 digital age.


Achieving TPM Excellence, the Fast Jet Way
My career spanning nearly four decades in Total Productive Maintenance (TPM) still amazes me with the quick progression and significant gains achieved by moving through the 8 stages of TPM.

Shaping The Future of Work: The Power of Mentoring and Coaching
Remember when you first stepped into the corporate world? A mixture of excitement and uncertainty consumed you. It was a brave new world full of opportunities, challenges, and tough decisions. How well you navigated this landscape often depended on who was there to guide you. This is a tale of two generations, with differing expectations of work and the pivotal role mentoring and coaching play in bridging that gap.